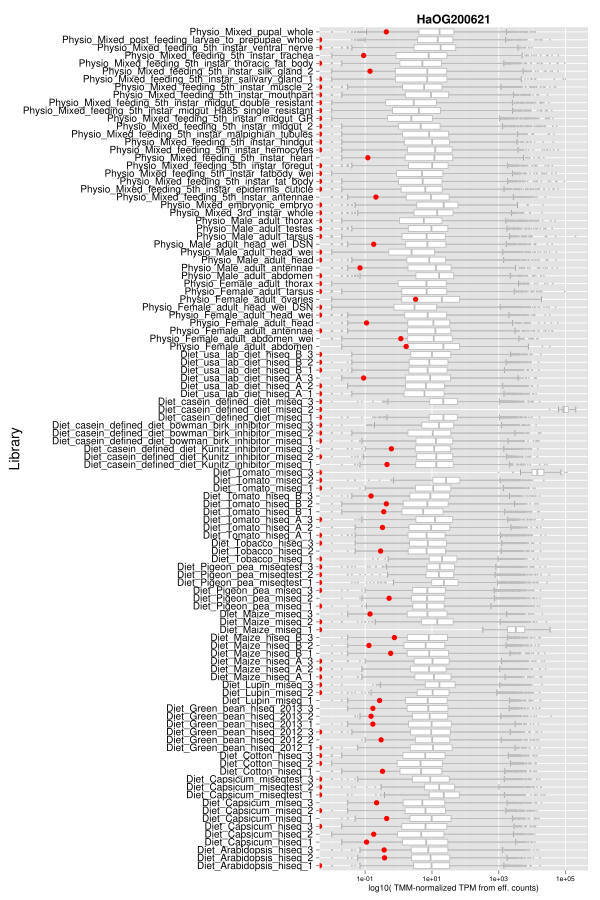
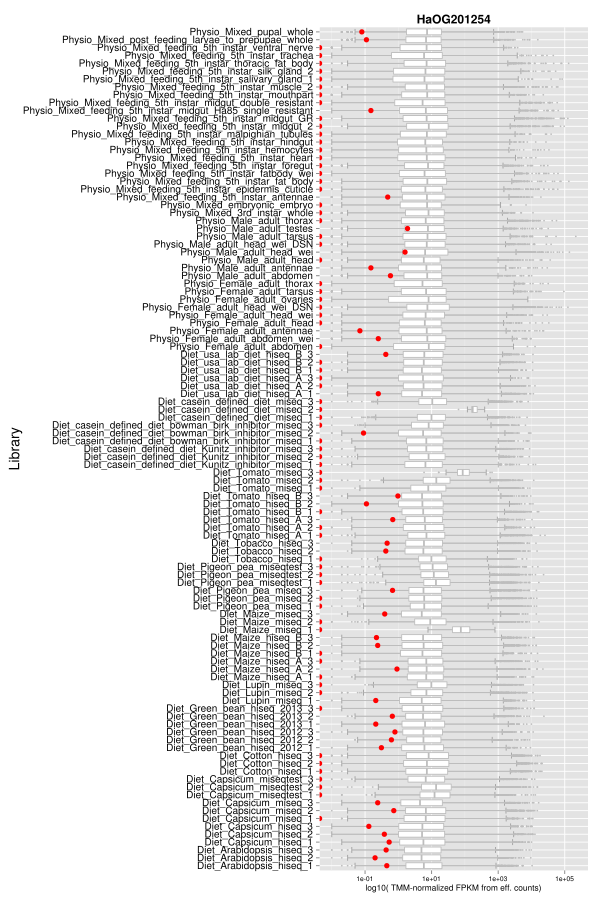
Differential expression as estimated by DEW. For each gene in the assembly an expression value was derived after normalizing eXpress' effective counts for library size and the Trimmed Mean of M-values (TMM) and converting it to a FPKM value. The boxplots in the background of each gene plot show the distribution of expression values for each library: The 1st & 3rd quartile and median of these expression value for the entire library. The bars of each boxplot (whiskers) extend up to 1.5 the length of the box (up to the max/min outlier point) while the grey points denote outliers. Then for each gene, a red dot denotes the actual expression value for each library. If the red dot intercepts the Y axis (i.e. near 0), then the gene deemed as not expressed.

